

The week of the Presidential and Congressional elections has arrived. Markets are likely primed for a week of high volatility as an immediate outcome is less likely this year, largely due to numerous mail in ballot operations that are more time consuming to process.
Stocks declined significantly this week as COVID-19 infections continue to increase and the November elections arrive. Economic data remained solid this week with manufacturing data, unemployment claims, and GDP all beating expectations. Unemployment claims have been choppy but trending downwards, likely indicating slowly recovering labor markets. Recently, unemployment declines have slowed somewhat, prompting questions as to whether or not the recovery may be coming to a halt. The persistently high and increasing case rates of COVID-19 in the U.S. remain concerning, as some analysts believe restrictive measures may be reinstated by state governors. The increase in cases has been statistically correlated with schools reopening, and thus may continue for several more weeks. Negotiations toward a second stimulus package are effectively on hold until after the election. The question now is whether or not a package will be passed this year.
Overseas, developed markets and emerging markets both fell. European indices have reeled under the reimposed lockdown restrictions, while Japanese equities returned mildly negative results.
Markets fell this week, with equity indices bringing in negative returns. Fears concerning global stability and health are an unexpected factor in asset values, and the recent volatility serves as a great reminder of why it is so important to remain committed to a long-term plan and maintain a well-diversified portfolio. When stocks were struggling to gain traction last month, other asset classes such as gold, REITs, and US Treasury bonds proved to be more stable. flashy news headlines can make it tempting to make knee-jerk decisions, but sticking to a strategy and maintaining a portfolio consistent with your goals and risk tolerance can lead to smoother returns and a better probability for long-term success.
Chart of the Week
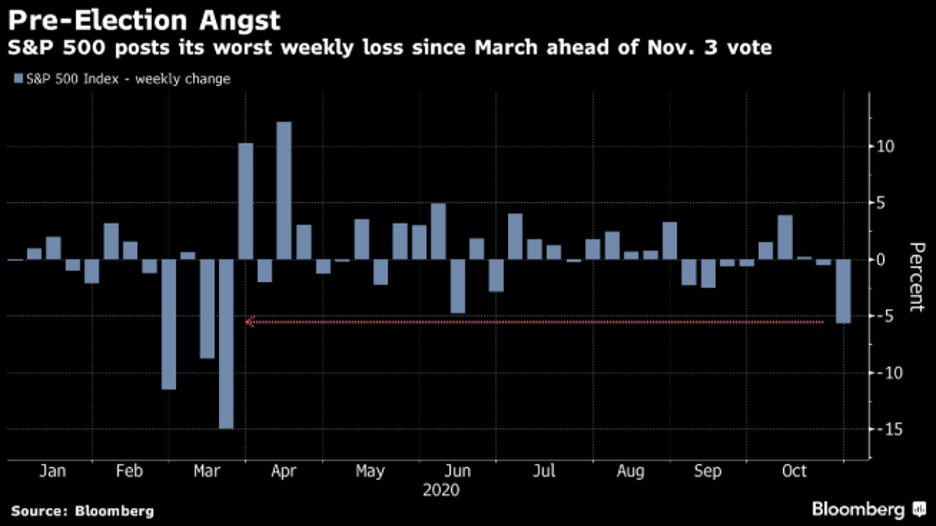
The S&P 500 registered its worst return in more than six months leading into the November election. Investors appear to be positioning for further market uncertainty and potential political upheaval.
Market Update
Equities
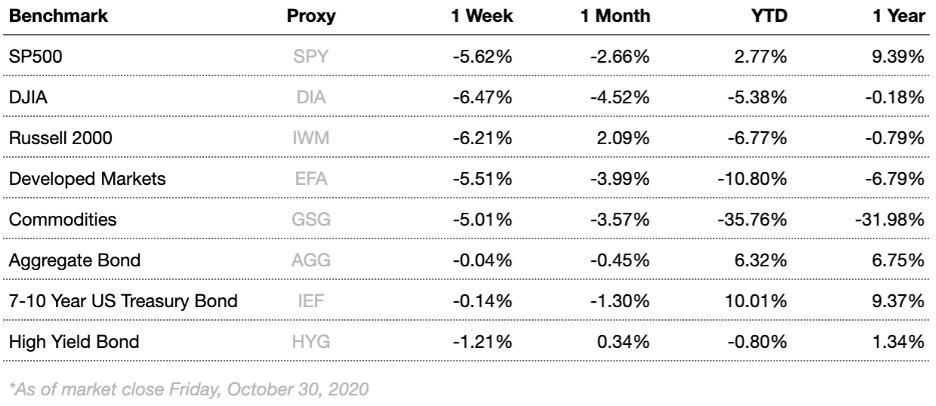
Broad market equity indices finished the week down, with major large cap indices underperforming small cap. Economic data has been solid, but the global recovery is still threatened by COVID-19.
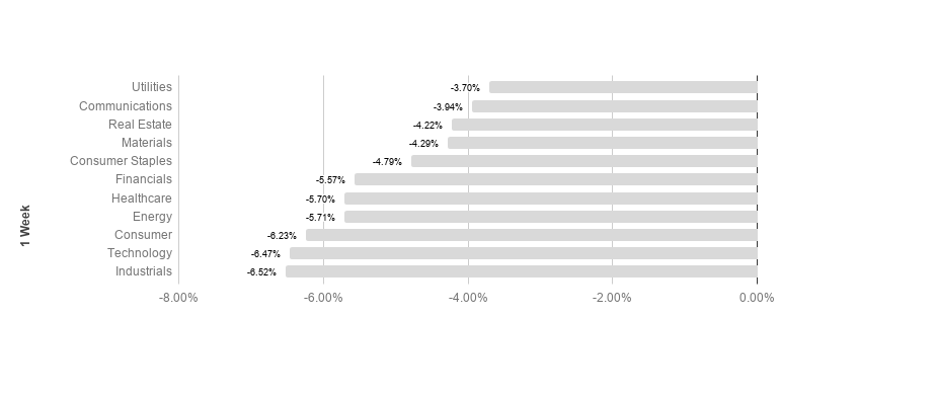
S&P sectors returned negative results this week. Utilities and communications outperformed, returning -3.70% and -3.94% respectively. Technology and industrials underperformed, posting -6.47% and -6.52% respectively. Technology leads the pack so far YTD, returning 20.95% in 2020.

Commodities
Commodities fell this week, driven by falling oil prices. Energy markets have been highly volatile, with oil investors focusing on output and consumption concerns. Demand is still likely to recover slowly however, and recent lockdown restrictions in Europe have raised doubts as to whether demand is going to continue in a positive direction. On the supply side, operating oil rigs are still well under early 2020 numbers, but trending upwards.
Gold fell this week, settling only slightly lower than last week’s close. Gold is a common “safe haven” asset, typically rising during times of market stress. Focus for gold has shifted to global macroeconomics and recovery efforts.
Bonds
Yields on 10-year Treasuries rose this week from 0.84% to 0.87% while traditional bond indices fell. Treasury yield movements reflect general risk outlook, and tend to track overall investor sentiment. Treasury yields will continue to be a focus as analysts watch for signs of changing market conditions.
High-yield bonds fell this week as spreads loosened. High-yield bonds are likely to remain volatile in the short to intermediate term as the Fed has adopted a remarkably accommodative monetary stance and investors flee economic risk factors, likely driving increased volatility.
Lesson to Be Learned
“The individual investor should act consistently as an investor and not as a speculator. This means … that he should be able to justify every purchase he makes and each price he pays by impersonal, objective reasoning that satisfies him that he is getting more than his money’s worth for his purchase.”
-Ben Graham
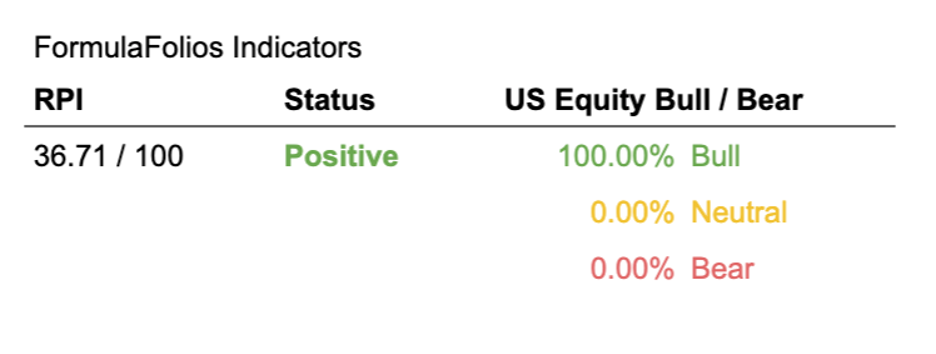
We have two simple indicators we share that help you see how the economy is doing (we call this the Recession Probability Index, or RPI), as well as if the US Stock Market is strong (bull) or weak (bear).
In a nutshell, we want the RPI to be low on a scale of 1 to 100. For the US Equity Bull/Bear indicator, we want it to read at least 66.67% bullish. When those two things occur, our research shows market performance is typically stronger, with less volatility.
The Recession Probability Index (RPI) has a current reading of 36.71, forecasting a lower potential for an economic contraction (warning of recession risk). The Bull/Bear indicator is currently 100% bullish, meaning the indicator shows there is a slightly higher than average likelihood of stock market increases in the near term (within the next 18 months).
It can be easy to become distracted from our long-term goals and chase returns when markets are volatile and uncertain. It is because of the allure of these distractions that having a plan and remaining disciplined is mission critical for long term success. Focusing on the long-run can help minimize the negative impact emotions can have on your portfolio and increase your chances for success over time.
The Week Ahead
This week will likely see the winner of the U.S. presidential election, as well as congressional elections. Economic releases include PMI data as well as October payroll numbers.
More to come soon. Stay tuned.
