

Stocks fell this week even as manufacturing data shined. The S&P 500 fell from intraweek all time highs on Wednesday. Economic data was mixed this week, but overall indicative of further economic recovery. Labor conditions and manufacturing were strong this week as the most recent initial claims were at the lowest level since March 19, while manufacturing PMI numbers came in at the highest level since February 2019. Unemployment claims are likely to remain elevated for several more weeks, but the unemployment rate has now dropped below the peak of the great recession during 2008-2009. The persistently high case rates of COVID-19 in the U.S. remains concerning, but infection rates seem to be slowly but steadily decreasing. Congress is still attempting to pass a second round of stimulus, but the Democrat controlled House and Republican controlled Senate have not been able to make significant progress towards a deal.
Overseas, developed markets fell along with emerging markets. European indices returned negative results for the week. Japanese equities diverged from much of the rest of the world, returning positive performance. As global economies continue to work towards business as usual, analysts are hoping COVID-19 infections are brought further under control so that focus can dial in more on global recovery efforts.
Markets fell this week, with equity indices bringing in mostly negative returns. Fears concerning global stability and health are an unexpected factor in asset values, and the recent volatility serves as a great reminder of why it is so important to remain committed to a long-term plan and maintain a well-diversified portfolio. When stocks were struggling to gain traction last month, other asset classes such as gold, REITs, and US Treasury bonds proved to be more stable. flashy news headlines can make it tempting to make knee-jerk decisions, but sticking to a strategy and maintaining a portfolio consistent with your goals and risk tolerance can lead to smoother returns and a better probability for long-term success.
Chart of the Week

While the labor market recovery has been robust, rates of recovery are beginning to decline. Many economists believe that for hiring to accelerate again, COVID-19 infections must be brought under control. The unemployment rate has continued to fall, with the rate of 8.4% coming in at the peak unemployment rate of the Great Recession.
Market Update
Equities
Broad market equity indices finished the week down, with major large cap indices outperforming small cap. Economic data has continued to be mostly positive, but the global recovery still has a long way to go to regain lost jobs and output.
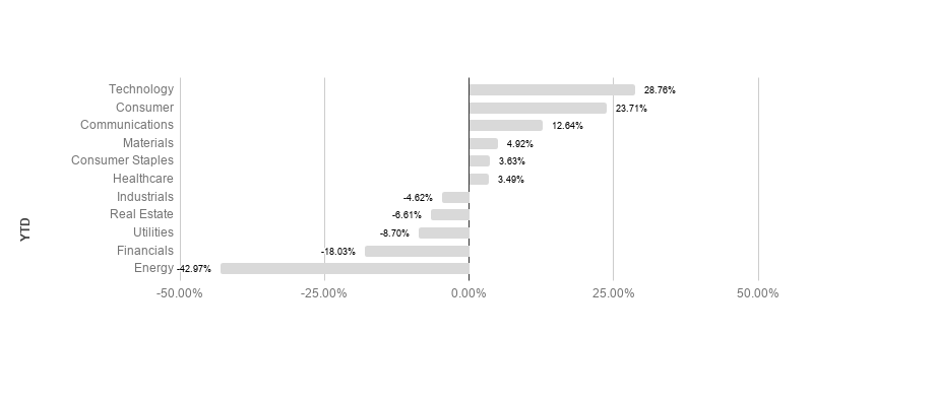
S&P sectors returned mostly negative results this week, as only materials and utilities returned positive results. Materials and utilities returned 0.79% and 0.43% respectively. Technology and energy performed the worst, posting -4.15% and -4.46% respectively. Technology leads the pack so far YTD, returning 28.76% in 2020.

Commodities
Commodities fell this week, driven by energy and metal prices underpinned by a strengthening US dollar. Energy markets have been highly volatile, with oil investors focusing on output and consumption concerns. Economic improvements have lifted demand outlook, while normal economic activities should continue recovering. Demand is still likely to recover slowly however, as economic activity is not likely to recover instantly. On the supply side, operating oil rigs are still well under early 2020 numbers.
Gold fell this week as markets reacted to COVID-19 data as well as macroeconomic data. Gold is a common “safe haven” asset, typically rising during times of market stress. Focus for gold has shifted to global macroeconomics and recovery efforts. A strengthening US dollar further undermined gold this week as ongoing dollar weakness receded slightly.
Bonds
Yields on 10-year Treasuries declined negligibly to finish the week just under 0.72% while traditional bond indices rose. Treasury yield movements reflect general risk outlook, and tend to track overall investor sentiment. Treasury yields will continue to be a focus as analysts watch for signs of changing market conditions.
High-yield bonds fell this week, causing spreads to loosen. High-yield bonds are likely to remain volatile in the short to intermediate term as the Fed has adopted a remarkably accommodative monetary stance and investors flee economic risk factors, likely driving increased volatility.

Lesson to Be Learned
“In the short run, the market is a voting machine, but in the long run it is a weighing machine.”
-Ben Graham
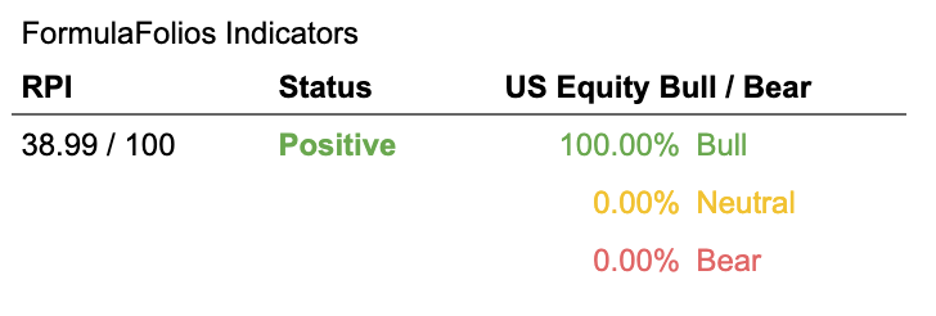
We have two simple indicators we share that help you see how the economy is doing (we call this the Recession Probability Index, or RPI), as well as if the US Stock Market is strong (bull) or weak (bear).
In a nutshell, we want the RPI to be low on a scale of 1 to 100. For the US Equity Bull/Bear indicator, we want it to read at least 66.67% bullish. When those two things occur, our research shows market performance is typically stronger, with less volatility.
The Recession Probability Index (RPI) has a current reading of 38.99, forecasting a lower potential for an economic contraction (warning of recession risk). The Bull/Bear indicator is currently 100% bullish, meaning the indicator shows there is a slightly higher than average likelihood of stock market increases in the near term (within the next 18 months).
It can be easy to become distracted from our long-term goals and chase returns when markets are volatile and uncertain. It is because of the allure of these distractions that having a plan and remaining disciplined is mission critical for long term success. Focusing on the long-run can help minimize the negative impact emotions can have on your portfolio and increase your chances for success over time.
The Week Ahead
This week is light on high impact economic releases. New consumer inflation numbers as well as new unemployment claim data will be released this week, analysts will be looking for continued positive momentum.
More to come soon. Stay tuned.
